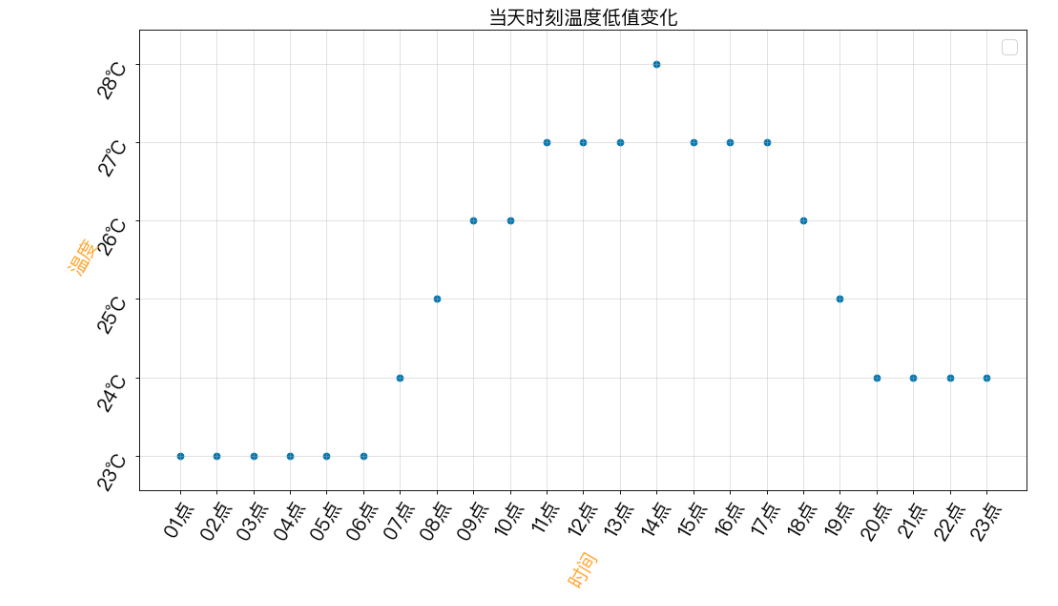
Python爬虫爬取杭州24时温度并展示操作示例
(编辑:jimmy 日期: 2025/1/13 浏览:2)
本文实例讲述了Python爬虫爬取杭州24时温度并展示操作。分享给大家供大家参考,具体如下:
散点图 爬虫杭州今日24时温度 https://www.baidutianqi.com/today/58457.htm
- 利用正则表达式爬取杭州温度
- 面向对象编程
- 图表展示(散点图 / 折线图)
导入相关库
import requests
import re
from matplotlib import pyplot as plt
from matplotlib import font_manager
import matplotlib
类代码部分
class Weather(object):
  def __init__(self):
    self.url = 'https://www.baidutianqi.com/today/58457.htm'
    self.headers = {'user-agent': 'Mozilla/5.0 (Windows NT 10.0; Win64; x64) AppleWebKit/537.36 (KHTML, like Gecko) Chrome/73.0.3683.75 Safari/537.36'}
  #请求
  def __to_requests(self):
    response = requests.get(url=self.url,headers=self.headers)
    return self.__to_paeser(response.content.decode('utf-8'))
  #解析
  def __to_paeser(self,html):
    #正则表达式 要从数据循环的部分写起 如果从循环的父标签开始 , 则只会匹配到一个值 即父标签下的某个标签 , 而不是循环下的
    pattern = re.compile('<li>.*"red">(.*"blue">(.*"{}℃".format(i) for i in range(min(y),max(y)+1)]
    plt.yticks(range(min(y),max(y)+1),y_ticks,fontproperties=my_font,rotation=60)
    # x y 轴说明
    plt.xlabel('时间',color='orange',rotation=60,fontproperties=my_font)
    plt.ylabel('温度',color='orange',rotation=60,fontproperties=my_font)
    #网格
    plt.grid(alpha=0.4)
    #标题
    plt.title('当天时刻温度低值变化',fontproperties=my_font)
    #图例
    plt.legend(prop=my_font)
    #作画
#     plt.scatter(x,y,label='2019-08-22')
    plt.plot(x,y,color='red')
    plt.show()
  #操作
  def to_run(self):
    result = self.__to_requests()
    self.__to_show(result)
调用并展示
if __name__ == '__main__':
  wt = Weather()
  wt.to_run()
更多关于Python相关内容可查看本站专题:《Python Socket编程技巧总结》、《Python正则表达式用法总结》、《Python数据结构与算法教程》、《Python函数使用技巧总结》、《Python字符串操作技巧汇总》、《Python入门与进阶经典教程》及《Python文件与目录操作技巧汇总》
希望本文所述对大家Python程序设计有所帮助。

